Tuesday, December 1, 2020

Testing a Risk on / Risk off indicator for system trading

 The purpose of this post is to test whether we can use a simple risk on / risk off indicator for our portfolio. This indicator was taken from the paper "Risk on- Risk off: a regime switching model for active portfolio management" by José P. Dapena, Juan A. Serur and Julián R. Siri.

 Their purpose is "to evaluate if there is an active management premium by testing performance with a non-conventional multifactor model, constructed with a Hidden Markov model which depending on the market states signaled by the level of volatility spread". In other words, and to make it simple: "when the most likely state is one with a low volatility spread, which means that the realised volatility is increasing more than the implied volatility, the strategy allocates the funds in short-term Treasuries, and the strategy becomes 'risk off'; otherwise, the strategy allocates the funds in the S&P 500, where the strategy becomes 'risk on' ".


Rules:

  • Our 'risk on' allocation is going to be the SPY as a proxy of the S&P 500; and our 'risk off' allocation will be the TLT as a proxy for Treasuries.
  • Option1 will be a portfolio where:
    • 'Risk on' if yesterdays' realized volatility is lower than implied volatility.
    • 'Risk off' is yesterday's realized volatility is greater than implied volatility.
  • Option2 wil be a portfolio where:
    • 'Risk on' if last five days' increase in realized volatility is lower than last five days' increase in implied volatility.
    • 'Risk off' if last five days' increase in realized volatility is greater than last five days' increase in implied volatility.
  • VIX Index is going to be our proxy for implied volatility.
  • Our window to calculate the realized volatility will be three weeks or fifteen days.
  • Python code can be downloaded here.


Therefore, we will have four different portfolios: a buy & hold in the SPY ETF, a 60/40 portfolio where we invest 60% of the portfolio in the SPY ETF and 40% in the TLT ETF, the Option1 portfolio and Option2 portfolio. These are the equity curves for all four portfolios for the last 17 years:


And the corresponding drawdowns for each of the four portfolios are:


Finally, all descriptive statistics are shown below:


As we can see above, both 'Risk on' / 'Risk off' portfolios outperformed all other portfolios in terms of 'Total Return' and 'Maximum Drawdown'. However, if we take into account volatility, only the Option1 portfolio got a better 'Sharpe Ratio' than the 60/40 portfolio, mainly because its 'Annual Return' doubles the one achieved by the 60/40 portfolio.

 Results are very similar to those shown in the paper in terms of Sharpe Ratio (0.89) and Max Drawdown (-26%), the paper shows an Annual Return of 11.36% with a 12.71% volatility.

We can conclude that volatility spread could be a good indicator for timing a risky portfolio. However, we have to keep in mind that transactions costs were not taken into account in this simulation; that can change the results since we are going long and short almost everyday. Probably, it will be better to look at weekly or monthly rotations.

We will keep studying it...

Tuesday, November 10, 2020

¿Rotación a Value?

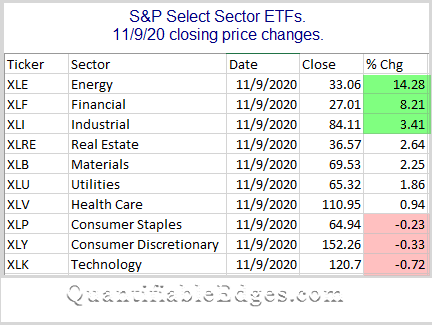
Muchas son las voces que hablan de la rotación de carteras que se produjo ayer con el anuncio de una posible vacuna para el Covid-19 por parte de Pfizer. La web QuantifiableEdges lo resumía perfectamente en el siguiente gráfico:


En nuestro caso, vimos un gran comportamiento en la Cartera Value que mantenemos con una subida del 5.49% en el día de ayer, situándola este mes con una rentabilidad acumulada superior al 10% en el mes de Noviembre.

En comparación, tenemos la Cartera Growth que subio tan sólo un 1.07% en el día de ayer  y acumula un 6.49% en lo que llevamos de mes de Noviembre.

Estaremos atentos a final de mes qué nos marca nuestro indicador de cambio de carteras Growth-Value, que se mantiene de momento este mes en Growth.

Sunday, November 1, 2020

Z-score Indicator based Trading System on Ibex 35

 Back in 2016 I found an strategy I have been following since. This trading system is based on an index z-score. The z-statistic is the number of standard deviations of a single point from the data's mean over the lookback period chosen.

The study was done in different shares from the S&P600, and was profitable in 533 of them  during the 13 years the trading system was tested. Moreover, it showed an 69% winners trades with and average gain per trade of 0.95%.

Rules:

  • We are going to use the Spanish Index Ibex 35
  • Calculate the z-score for different periods (week, fortnight, month and quarter)
  • The Z-target is going to be 1, since we know that 68% of every standard normal distribution is between -1 and 1.
  • We are always long or short. Buying means closing short position and open a new long position, and vice versa.
  • Buy at close of the daily bar when z-score crosses downward through the negative Z-target.
  • Sell at close of the daily bar when z-score crosses upward through the positive Z-target.
  • We are long or short one contract each  day.
  • Commissions are not taken into account.

Results:


The results are shown from 2000 until September 2020, and for the last 5 years.

As you can see, all different Z-periods used show better results than the Index in both time periods. Moreover, the indicator calculated every fortnight shows very stable results in both tables; proving to be the best during the last five years and second best for the whole period.

The equity curves for the best two indicators in every period, with the Index, are shown below:


Would you trade it? Probably not. You, and probably no one, would have followed an strategy with a -38% drawdown from years 2004 to 2007 when the Spanish Index Ibex 35 almost double.

But probably it would be a good start for something better...


Wednesday, October 28, 2020

Señal de compra en Ibex 35

Hoy, a cierre del futuro español, tenemos señal de compra en el Ibex 35 con objetivo de cierre de posición en una semana (el próximo 4 de Noviembre).

Aquí os muestro la evolución de dicha señal de compra desde 1994: en el gráfico de arriba las señales de compra y venta; en el gráfico de abajo la evolución de la cuenta de trading que llevo en esta estrategia.


Actulizado el 29/10/20: Situamos stop de posición en 6361

Eurostoxx objetivo bajista


El índice Eurostoxx 50 está rompiendo en el día de hoy el canal bajista que llevaba desde mediados de año. Si no consigue retomar el anterior soporte (ahora resistencia) de los 3000 puntos, daríamos un objetivo de 2775 puntos en el corto-medio plazo.


Tuesday, October 20, 2020

Buy recommendation trading Telefónica


After four attempts to break above the downward trendline, Telefonica broke above it two weeks ago.

Now, it is bouncing back to the previous resistance at 2.97

We enter long in Telefonica with a price target of 3.5 and stop loss in any close below 2.


Monday, September 28, 2020

¿Acciones valor o acciones crecimiento?

 Recientemente leí un artículo publicado por Jay Kaeppel en el que comenta la dispar evolución de las acciones categorizadas como Value y aquellas categorizadas como Growth. Para ello el autor utiliza dos índices que tenemos fácilmente accesibles vía ETF: el Russell 1000 Growth y el Russell 2000 Value. Y la pregunta que se plantea es la siguiente:¿qué tipología de acciones son más favorables para mi inversión?

Para responder esta pregunta el autor mira a la rentabilidad de los últimos diez años de cada uno de los índices y calcula la diferencia entre ambos. Es decir, crea un indicador ( azul) definido por la rentabilidad de los últimos 10 años del Russell 1000 Growth menos la rentabilidad de los últimos 10 años del Russell 2000 Value. A este indicador le aplica una media móvil de los 13 últimos meses (linea naranja) creando dos posibles actuaciones: si el indicador está por encima de su media móvil optariamos por invertir en acciones Growth, y si el indicador se encuentra por debajo de la media optariamos por acciones Value:
No hay texto alternativo para esta imagenEl autor compara su resultado con cada uno de los índices por separado. Yo, personalmente, me gusta más la comparación con el S&P500 ya que es un benchmark bastante utilizado por cualquier cartera de inversión.
No hay texto alternativo para esta imagen
En este gráfico podéis ver la evolución de una inversión efectuada siguiendo dicho indicador frente a una inversión igual en el S&P500 desde el 1 de Enero del 2000 hasta Agosto de este año 2020. Esto nos da una rentabilidad anual del 11.10% siguiendo el indicador frente al 5.35% anual del S&P500, y con un drawdown de casi un veinte por ciento inferior (-42.54% frente al -52.56% del S%P500).

Ésto me recordó uno de los trabajos que escribí para mi tesis doctoral y decidí añadirlo al estudio de forma comparativa. Se trata de seguir el spread o cociente entre ambos índices; de tal forma que si el spread está por encima de la media invertiremos en acciones Growth y de lo contrarío invertiremos en acciones Value.

No hay texto alternativo para esta imagen

Los resultados obtenidos los podéis ver en la siguiente tabla. Podemos observar como los resultados obtenidos por este nuevo spread se asemejan mucho a los que plantea este autor en el largo plazo, salvo en el caso del drawdown que es algo superior.

Sin embargo, si miramos en los últimos diez y cinco años, podemos observar en los gráficos finales como las cosas cambian sustancialmente. En ambos casos el nuevo indicador spread supera tanto al anterior indicador como al S&P500, consiguiendo ratios de Sharpe por encima de la unidad y drawdown similares a los del indicador planteado. En cuanto a rentabilidades obtenemos una rentabilidad media anual del 15.56% en los últimos diez años (frente al 11.51% del S&P500) y un 20.56% anual en los últimos cinco años (frente al 12.67% del S&P500).
No hay texto alternativo para esta imagen

Por lo tanto, si lo que quiero es estar en renta variable pero no tengo claro si invertir en valores Valor o Crecimiento, este puede ser un buen indicador a tener en cuenta por su sencillez y efectividad.