En nuestro caso, vimos un gran comportamiento en la Cartera Value que mantenemos con una subida del 5.49% en el día de ayer, situándola este mes con una rentabilidad acumulada superior al 10% en el mes de Noviembre.
Tuesday, November 10, 2020
¿Rotación a Value?
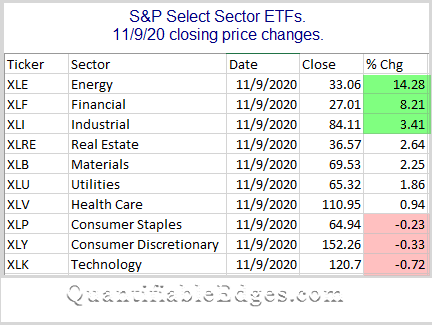
Muchas son las voces que hablan de la rotación de carteras que se produjo ayer con el anuncio de una posible vacuna para el Covid-19 por parte de Pfizer. La web QuantifiableEdges lo resumía perfectamente en el siguiente gráfico:
En nuestro caso, vimos un gran comportamiento en la Cartera Value que mantenemos con una subida del 5.49% en el día de ayer, situándola este mes con una rentabilidad acumulada superior al 10% en el mes de Noviembre.
En nuestro caso, vimos un gran comportamiento en la Cartera Value que mantenemos con una subida del 5.49% en el día de ayer, situándola este mes con una rentabilidad acumulada superior al 10% en el mes de Noviembre.
En comparación, tenemos la Cartera Growth que subio tan sólo un 1.07% en el día de ayer y acumula un 6.49% en lo que llevamos de mes de Noviembre.
Estaremos atentos a final de mes qué nos marca nuestro indicador de cambio de carteras Growth-Value, que se mantiene de momento este mes en Growth.
Sunday, November 1, 2020
Z-score Indicator based Trading System on Ibex 35
Back in 2016 I found an strategy I have been following since. This trading system is based on an index z-score. The z-statistic is the number of standard deviations of a single point from the data's mean over the lookback period chosen.
The study was done in different shares from the S&P600, and was profitable in 533 of them during the 13 years the trading system was tested. Moreover, it showed an 69% winners trades with and average gain per trade of 0.95%.
Rules:
- We are going to use the Spanish Index Ibex 35
- Calculate the z-score for different periods (week, fortnight, month and quarter)
- The Z-target is going to be 1, since we know that 68% of every standard normal distribution is between -1 and 1.
- We are always long or short. Buying means closing short position and open a new long position, and vice versa.
- Buy at close of the daily bar when z-score crosses downward through the negative Z-target.
- Sell at close of the daily bar when z-score crosses upward through the positive Z-target.
- We are long or short one contract each day.
- Commissions are not taken into account.
Results:

The results are shown from 2000 until September 2020, and for the last 5 years.
As you can see, all different Z-periods used show better results than the Index in both time periods. Moreover, the indicator calculated every fortnight shows very stable results in both tables; proving to be the best during the last five years and second best for the whole period.
The equity curves for the best two indicators in every period, with the Index, are shown below:
Would you trade it? Probably not. You, and probably no one, would have followed an strategy with a -38% drawdown from years 2004 to 2007 when the Spanish Index Ibex 35 almost double.
But probably it would be a good start for something better...
Subscribe to:
Posts (Atom)
-
Back in 2016 I found an strategy I have been following since. This trading system is based on an index z-score. The z-statistic is the numb...
-
Terminamos la semana con máximos anuales en las bolsas de ambos lados del atlántico, y otra vez cerca de máximos en el caso del índice em...
-
Telefónica ha publicado resultados con un beneficio récord de 7743 millones de Euros en el segundo trimestre de 2021, principalmente grac...


