Showing posts with label Ibex. Show all posts

Thursday, July 29, 2021

Análisis Técnico Telefónica y Resultados publicados

 Telefónica ha publicado resultados con un beneficio récord de 7743 millones de Euros en el segundo trimestre de 2021, principalmente gracias  la venta de Telxius en Latinoamérica a American Tower Corporation y a la fusión de O2 y Virgin Media. Sus ingresos han caído un -3.6% en interanual y su deuda se reduce en 11 mil millones de Euros hasta los 26.2 mil millones de Euros a Junio 2021.

En cuanto a sus objetivos para este año se mantienen sin muchos cambios,  con una estabilización o ligero crecimiento de los ingresos y el OIBDA. Además confirman el dividendo de 0.30 euros por acción para este 2021.

Sin embargo, desde un punto de vista técnico, a su acción le queda todavía un largo recorrido para romper la tendencia bajista que mantiene desde los máximos alcanzados a finales de 2007. Ahora mismo se encuentra en la mitad de su canal bajista de largo plazo, y sólo la superación de los 7.5 € por acción implicaría una ruptura de dicho canal bajista. Además, dado los mínimos alcanzados en 2020, este nivel de 7.5€ corresponde con una recuperación del 23.6% de toda la caída y además fue soporte en 2012 y 2016.

A más corto plazo, la ruptura de los 5 € por acción le podría dar fuerza para intentar atacar la directriz bajista de largo plazo y la resistencia de los 7.5 €. Mientras no supere los 5 euros por acción, mejor estar fuera.




Wednesday, March 3, 2021

Buying Stocks at all time highs?.... not for Europeans.

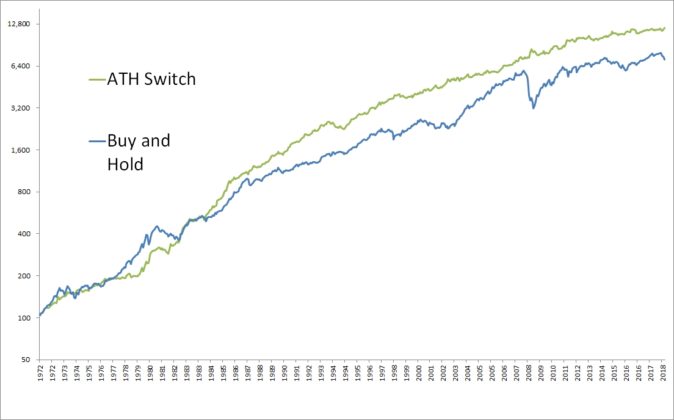
Recently, I was a looking at 2019 article from Meb Faber where he points out how GREAT has been to buy stocks at an all-time high. He did a study all the way back to the 1920s where he rebalances a monthly portfolio that is invested in Stocks if stocks closed the previous month at all time high, and if not, the portfolio is invested in bonds. The results below are taken from his post; the average portfolio is an equal weight across US stocks, foreign stocks, real estate, commodities and gold:


As an European investor, I wanted to see if that would have worked in the European markets. Therefore, I looked to apply the same logic to five of the main European indexes (Eurostoxx 50, CAC 40, FTSE MIB, Ibex 35 and Dax 30) as "stocks" and the SPDR Bloomberg Barclays Euro Government Bond ETF as "bonds". I used data for the last 10 years since it is when the ETF started to trade.

To all but the Dax 30 Index, we would have been invested in the "bonds" ETF for the whole period, since none of them have made new highs in the las 10 years. In the case of the Dax 30, the chart shows as follows:


As we see, following the strategy in these European indexes gave us the same return as being invested in bonds (even less in the case of the Dax 30).

After all these results, to main concerns come to my mind:

  • On the one hand, probably, the previous study was done for a long period where returns in the bond markets have been extraordinary goods. Nowadays, and in the last years, we are in a period where bonds' yields are at their lowest point in recent history, and probably returns in the bond markets are not going to be as they were in previous decades.

  • On the other hand, this points out why European investor should look to invest in the different markets. Home bias is dangerous tendency for investors to invest the majority of their portfolio in domestic equities. 
Being local does not pay when investing... at least last ten years.

Saturday, January 2, 2021

Z-score Trading System on Ibex 35 with Moving Average

Let's going to have a deeper look at the Ibex Strategy we talked about in the previous post back in November last year. Remember the rules:

  • We are going to use the Spanish Index Ibex 35
  • Calculate the z-score for different periods (week, fortnight)
  • we set a Z-target greater or equal than 1, since we know that 68% of every standard normal distribution is between -1 and 1.
  • We are always long or short. Buying means closing short position and open a new long position, and vice versa.
  • Buy at close of the daily bar when z-score crosses downward through the negative Z-target.
  • Sell at close of the daily bar when z-score crosses upward through the positive Z-target.
  • We are long or short one contract each  day.
  • Commissions are not taken into account.

The questions I want to answer here is: Does it work better when going long or short? Does it work better in a bull market or bear market? To answer those questions we are going to calculate some statistics depending on we are trading long or short, or if the Spanish Ibex 35 is above or below the 200 days moving average (in order to determine if we are in a bull or bear market).


As we can see in the above table, there some interesting statistics we can use in order to improve the expected outcome of this strategy in the future:

  • Both periods show better return in bear markets than in bull markets, but this is especially more significant the the Zfortnight strategy with more than double the average return per trade when the index is below the 200 days moving average than when the index is above the 200 days moving average.

  • Moreover, the average of winner trades are more than 80% when going long in a bull market than going short. However, this difference is not as big when the index is below the 200 days moving average.

Therefore, next step could be to study a "meta-strategy" that accommodates the position sizing depending on if the index is above or below the 200 days moving average and whether the signal has been long or short. In other words, there is an option to apply a better money management to improve the odds of the strategy being even more profitable.

Sunday, November 1, 2020

Z-score Indicator based Trading System on Ibex 35

 Back in 2016 I found an strategy I have been following since. This trading system is based on an index z-score. The z-statistic is the number of standard deviations of a single point from the data's mean over the lookback period chosen.

The study was done in different shares from the S&P600, and was profitable in 533 of them  during the 13 years the trading system was tested. Moreover, it showed an 69% winners trades with and average gain per trade of 0.95%.

Rules:

  • We are going to use the Spanish Index Ibex 35
  • Calculate the z-score for different periods (week, fortnight, month and quarter)
  • The Z-target is going to be 1, since we know that 68% of every standard normal distribution is between -1 and 1.
  • We are always long or short. Buying means closing short position and open a new long position, and vice versa.
  • Buy at close of the daily bar when z-score crosses downward through the negative Z-target.
  • Sell at close of the daily bar when z-score crosses upward through the positive Z-target.
  • We are long or short one contract each  day.
  • Commissions are not taken into account.

Results:


The results are shown from 2000 until September 2020, and for the last 5 years.

As you can see, all different Z-periods used show better results than the Index in both time periods. Moreover, the indicator calculated every fortnight shows very stable results in both tables; proving to be the best during the last five years and second best for the whole period.

The equity curves for the best two indicators in every period, with the Index, are shown below:


Would you trade it? Probably not. You, and probably no one, would have followed an strategy with a -38% drawdown from years 2004 to 2007 when the Spanish Index Ibex 35 almost double.

But probably it would be a good start for something better...


Wednesday, October 28, 2020

Señal de compra en Ibex 35

Hoy, a cierre del futuro español, tenemos señal de compra en el Ibex 35 con objetivo de cierre de posición en una semana (el próximo 4 de Noviembre).

Aquí os muestro la evolución de dicha señal de compra desde 1994: en el gráfico de arriba las señales de compra y venta; en el gráfico de abajo la evolución de la cuenta de trading que llevo en esta estrategia.


Actulizado el 29/10/20: Situamos stop de posición en 6361