Monday, January 18, 2021

Ratios Cartera Value y Growth

 Continuamos analizando un poco más en detalle la composición de cada una de las carteras de renta variable europea que planteábamos para los diferentes niveles de riesgo que queramos adoptar. Vamos ahora con dos de las carteras cuyo objetivo primordial es la de buscar acciones que están infravaloradas en términos value o que tienen un potencial de crecimiento importante.

Value Portfolio

Se trata de una cartera cuyo objetivo es invertir en acciones con una beta inferior a la media del mercado. Desde inicio en el año 2016, la volatilidad media anual de esta cartera es del 18.71% y la rentabilidad anual es del 12.10%.

La composición actual de la cartera presenta los siguientes parámetros:

  • Dividend Yield = 2.27%
  • Price Earnings Ratio (PER) = 13x
  • Cash Flow Yield = 23%
  • Price Book-Value = 1.4x
  • Current Ratio = 1.45
  • Return on Assets = 12.47%

Se trata de una cartera cuyo objetivo es invertir en acciones con una volatilidad inferior a la media del mercado. Desde inicio en el año 2018, la volatilidad media anual de esta cartera es del 21.59% y la rentabilidad anual es del 16.53%.

La composición actual de la cartera presenta los siguientes parámetros:

  • Dividend Yield = 2%
  • Price Earnings Ratio (PER) = 16x
  • Cash Flow Yield = 8.2%
  • Price Book-Value = 3.6x
  • Current Ratio = 1.83
  • Return on Assets = 12.75%


La correlación que existe entre las rentabilidades diarias de estas carteras es del 75%, en los dos últimos años.

Thursday, January 14, 2021

Ratios Cartera Beta y Volatilidad

 Vamos a analizar un poco más en detalle la composición de cada una de las carteras de renta variable europea que planteábamos para los diferentes niveles de riesgo que queramos adoptar. Empezamos con dos de las carteras cuyo objetivo primordial es el control de la volatilidad y tratar de minimizar los posibles drawdowns.

Beta Portfolio

Se trata de una cartera cuyo objetivo es invertir en acciones con una beta inferior a la media del mercado. Desde inicio en el año 2016, la volatilidad media anual de esta cartera es del 14.16% y la rentabilidad anual es del 14.41%.

La composición actual de la cartera presenta los siguientes parámetros:

  • Dividend Yield = 0.84%
  • Price Earnings Ratio (PER) = 44x
  • Cash Flow Yield = 10.04%
  • Price Book-Value = 2.93x
  • Current Ratio = 1.14
  • Return on Assets = 4.33%

Se trata de una cartera cuyo objetivo es invertir en acciones con una volatilidad inferior a la media del mercado. Desde inicio en el año 2018, la volatilidad media anual de esta cartera es del 15.52% y la rentabilidad anual es del 8.23%.

La composición actual de la cartera presenta los siguientes parámetros:

  • Dividend Yield = 1.70%
  • Price Earnings Ratio (PER) = 27x
  • Cash Flow Yield = 6.54%
  • Price Book-Value = 3.16x
  • Current Ratio = 1.46
  • Return on Assets = 5.72%


La correlación que existe entre las rentabilidades diarias de estas carteras es del 82%. Sin embargo, la correlación que mantienen con las otras carteras más arriesgadas es mucho menos; por ejemplo, la correlación entre la Beta Portfolio y la Value Portfolio es del 60% en los dos últimos años.

Sunday, January 3, 2021

Compra Acciones Europeas para Q1 2020

Año nuevo para nuestas carteras de valores. En los siguientes links podeis ver la evolución de todas y cada una de las estrategias de acciones europeas:

  • Beta Portfolio, que ha conseguido una rentabilidad del 5.25% en este año 2020
  • Value Portfolio, que ha conseguido una rentabilidad del 2.01% en este año 2020

Aqui teneis la lista de acciones para este primer trimestre del año 2021:


Saturday, January 2, 2021

Z-score Trading System on Ibex 35 with Moving Average

Let's going to have a deeper look at the Ibex Strategy we talked about in the previous post back in November last year. Remember the rules:

  • We are going to use the Spanish Index Ibex 35
  • Calculate the z-score for different periods (week, fortnight)
  • we set a Z-target greater or equal than 1, since we know that 68% of every standard normal distribution is between -1 and 1.
  • We are always long or short. Buying means closing short position and open a new long position, and vice versa.
  • Buy at close of the daily bar when z-score crosses downward through the negative Z-target.
  • Sell at close of the daily bar when z-score crosses upward through the positive Z-target.
  • We are long or short one contract each  day.
  • Commissions are not taken into account.

The questions I want to answer here is: Does it work better when going long or short? Does it work better in a bull market or bear market? To answer those questions we are going to calculate some statistics depending on we are trading long or short, or if the Spanish Ibex 35 is above or below the 200 days moving average (in order to determine if we are in a bull or bear market).


As we can see in the above table, there some interesting statistics we can use in order to improve the expected outcome of this strategy in the future:

  • Both periods show better return in bear markets than in bull markets, but this is especially more significant the the Zfortnight strategy with more than double the average return per trade when the index is below the 200 days moving average than when the index is above the 200 days moving average.

  • Moreover, the average of winner trades are more than 80% when going long in a bull market than going short. However, this difference is not as big when the index is below the 200 days moving average.

Therefore, next step could be to study a "meta-strategy" that accommodates the position sizing depending on if the index is above or below the 200 days moving average and whether the signal has been long or short. In other words, there is an option to apply a better money management to improve the odds of the strategy being even more profitable.

Tuesday, December 1, 2020

Testing a Risk on / Risk off indicator for system trading

 The purpose of this post is to test whether we can use a simple risk on / risk off indicator for our portfolio. This indicator was taken from the paper "Risk on- Risk off: a regime switching model for active portfolio management" by José P. Dapena, Juan A. Serur and Julián R. Siri.

 Their purpose is "to evaluate if there is an active management premium by testing performance with a non-conventional multifactor model, constructed with a Hidden Markov model which depending on the market states signaled by the level of volatility spread". In other words, and to make it simple: "when the most likely state is one with a low volatility spread, which means that the realised volatility is increasing more than the implied volatility, the strategy allocates the funds in short-term Treasuries, and the strategy becomes 'risk off'; otherwise, the strategy allocates the funds in the S&P 500, where the strategy becomes 'risk on' ".


Rules:

  • Our 'risk on' allocation is going to be the SPY as a proxy of the S&P 500; and our 'risk off' allocation will be the TLT as a proxy for Treasuries.
  • Option1 will be a portfolio where:
    • 'Risk on' if yesterdays' realized volatility is lower than implied volatility.
    • 'Risk off' is yesterday's realized volatility is greater than implied volatility.
  • Option2 wil be a portfolio where:
    • 'Risk on' if last five days' increase in realized volatility is lower than last five days' increase in implied volatility.
    • 'Risk off' if last five days' increase in realized volatility is greater than last five days' increase in implied volatility.
  • VIX Index is going to be our proxy for implied volatility.
  • Our window to calculate the realized volatility will be three weeks or fifteen days.
  • Python code can be downloaded here.


Therefore, we will have four different portfolios: a buy & hold in the SPY ETF, a 60/40 portfolio where we invest 60% of the portfolio in the SPY ETF and 40% in the TLT ETF, the Option1 portfolio and Option2 portfolio. These are the equity curves for all four portfolios for the last 17 years:


And the corresponding drawdowns for each of the four portfolios are:


Finally, all descriptive statistics are shown below:


As we can see above, both 'Risk on' / 'Risk off' portfolios outperformed all other portfolios in terms of 'Total Return' and 'Maximum Drawdown'. However, if we take into account volatility, only the Option1 portfolio got a better 'Sharpe Ratio' than the 60/40 portfolio, mainly because its 'Annual Return' doubles the one achieved by the 60/40 portfolio.

 Results are very similar to those shown in the paper in terms of Sharpe Ratio (0.89) and Max Drawdown (-26%), the paper shows an Annual Return of 11.36% with a 12.71% volatility.

We can conclude that volatility spread could be a good indicator for timing a risky portfolio. However, we have to keep in mind that transactions costs were not taken into account in this simulation; that can change the results since we are going long and short almost everyday. Probably, it will be better to look at weekly or monthly rotations.

We will keep studying it...

Tuesday, November 10, 2020

¿Rotación a Value?

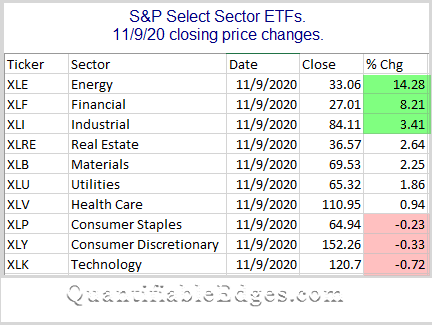
Muchas son las voces que hablan de la rotación de carteras que se produjo ayer con el anuncio de una posible vacuna para el Covid-19 por parte de Pfizer. La web QuantifiableEdges lo resumía perfectamente en el siguiente gráfico:


En nuestro caso, vimos un gran comportamiento en la Cartera Value que mantenemos con una subida del 5.49% en el día de ayer, situándola este mes con una rentabilidad acumulada superior al 10% en el mes de Noviembre.

En comparación, tenemos la Cartera Growth que subio tan sólo un 1.07% en el día de ayer  y acumula un 6.49% en lo que llevamos de mes de Noviembre.

Estaremos atentos a final de mes qué nos marca nuestro indicador de cambio de carteras Growth-Value, que se mantiene de momento este mes en Growth.

Sunday, November 1, 2020

Z-score Indicator based Trading System on Ibex 35

 Back in 2016 I found an strategy I have been following since. This trading system is based on an index z-score. The z-statistic is the number of standard deviations of a single point from the data's mean over the lookback period chosen.

The study was done in different shares from the S&P600, and was profitable in 533 of them  during the 13 years the trading system was tested. Moreover, it showed an 69% winners trades with and average gain per trade of 0.95%.

Rules:

  • We are going to use the Spanish Index Ibex 35
  • Calculate the z-score for different periods (week, fortnight, month and quarter)
  • The Z-target is going to be 1, since we know that 68% of every standard normal distribution is between -1 and 1.
  • We are always long or short. Buying means closing short position and open a new long position, and vice versa.
  • Buy at close of the daily bar when z-score crosses downward through the negative Z-target.
  • Sell at close of the daily bar when z-score crosses upward through the positive Z-target.
  • We are long or short one contract each  day.
  • Commissions are not taken into account.

Results:


The results are shown from 2000 until September 2020, and for the last 5 years.

As you can see, all different Z-periods used show better results than the Index in both time periods. Moreover, the indicator calculated every fortnight shows very stable results in both tables; proving to be the best during the last five years and second best for the whole period.

The equity curves for the best two indicators in every period, with the Index, are shown below:


Would you trade it? Probably not. You, and probably no one, would have followed an strategy with a -38% drawdown from years 2004 to 2007 when the Spanish Index Ibex 35 almost double.

But probably it would be a good start for something better...